

Sankey diagram
Show how a quantity splits and merges between stages, with each flow as thick as its value.
Diagram · origin tag etalii/sankey · Data-oriented diagrams
Availability
| Host | State | How to get it |
|---|---|---|
| Standalone | Prototype | Not yet released |
| Desktop | Prototype | Not yet released |
| IntelliJ Platform | Not planned | Not planned |
| Visual Studio Code | Not planned | Not planned |
| Eclipse | Idea | Not planned |
| ThinkRail | Not planned | Not planned |
| Notion | Not planned | Not planned |
| Claude | Not planned | Not planned |
What it is for
Sankey diagram (nodes in columns joined by flows whose thickness follows their value, drawn as smooth translucent bands in the income-statement style of annual reports; domain agnostic, with a twelve-word colour palette or custom hex per node and flow, a thickness scale, values stepped in place, and nodes dragged within their column while the others make room; `.skv` — Sankey Diagram Visualization, ADP's own YAML schema, registered by an `.adp` file); `sankey`
Why a specialized view helps
A Sankey diagram's meaning is in its proportions: flow thickness must follow value, columns must balance and bands must curve cleanly between stacked bars, which a generic canvas leaves to hand-drawing.
File formats
| Extension | Format | Reads | Writes |
|---|---|---|---|
.skv | .skv | Yes | Yes |
Screenshots
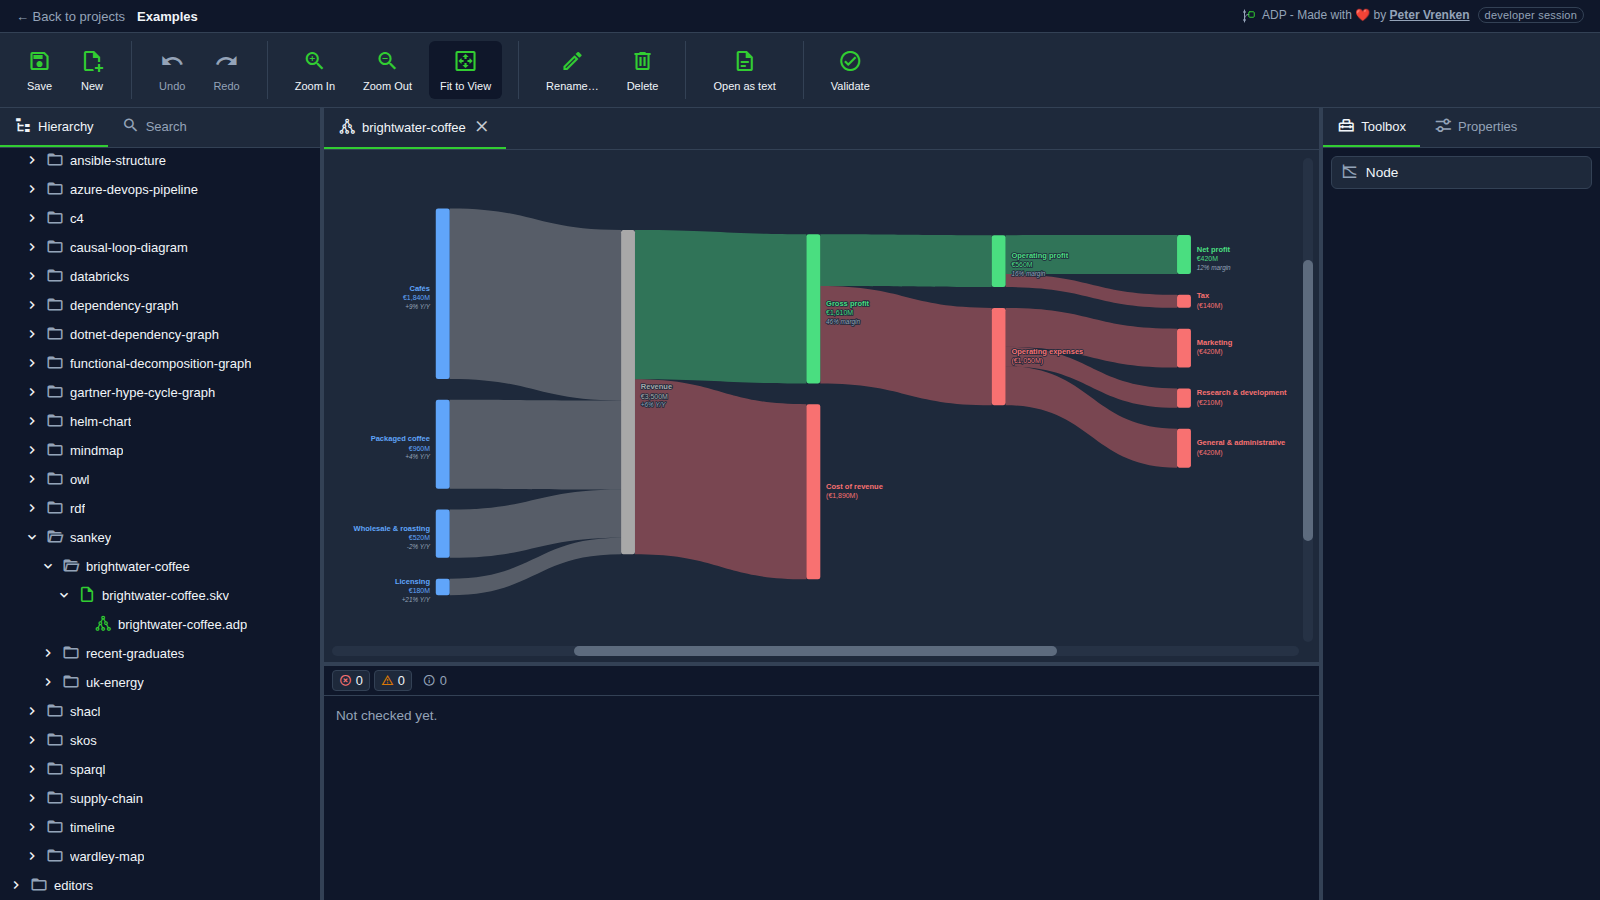
Standalone, at c400088
What is visible: The coffee company's income statement as columns of nodes joined by translucent bands as thick as their value: four revenue streams on the left flowing into revenue, then gross profit and cost of revenue, and on to operating expenses, tax and net profit on the right; Toolbox showing Node. Nothing selected.
Why it matters: Every band is as thick as the money it carries, so an income statement shows at once where revenue comes from and how much of it each cost takes before profit, the proportions a table of figures leaves the reader to compute.
Licence: Apache-2.0
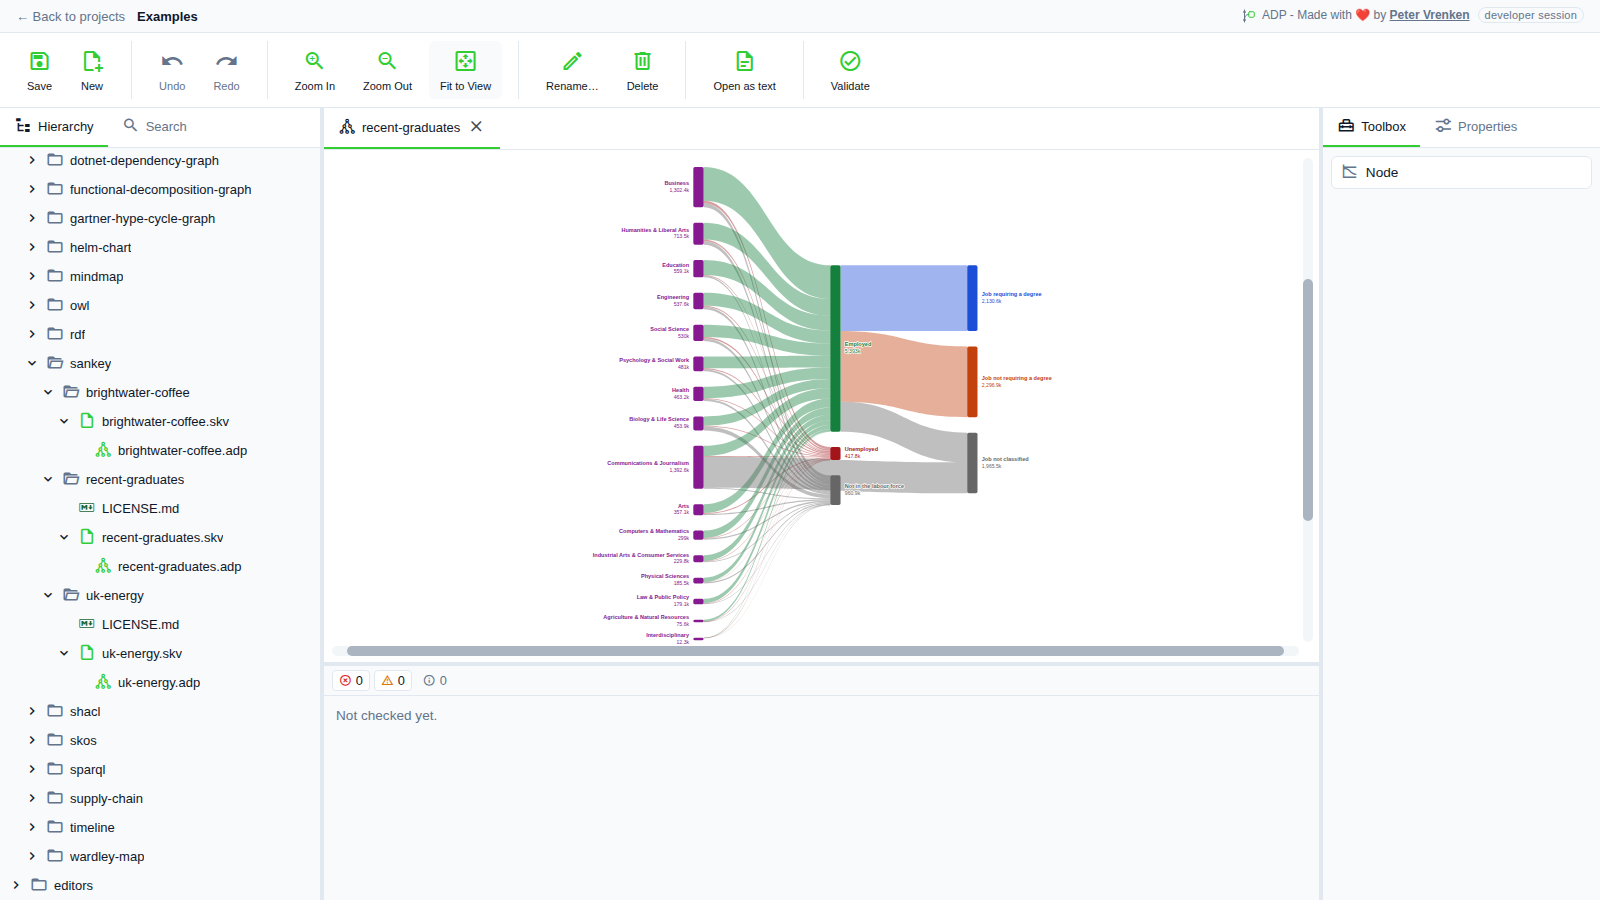
Standalone, at 2bf65f1
What is visible: In the light theme: the fields of study on the left flowing into employed, unemployed and not in the labour force, and the employed on into jobs that do or do not require a degree. Nothing selected.
Why it matters: Each field of study splits into employment outcomes and on into jobs that do or do not need a degree, with thickness following the number of graduates, so the balance between columns is visible in the light theme as well as the dark one.
Licence: Apache-2.0
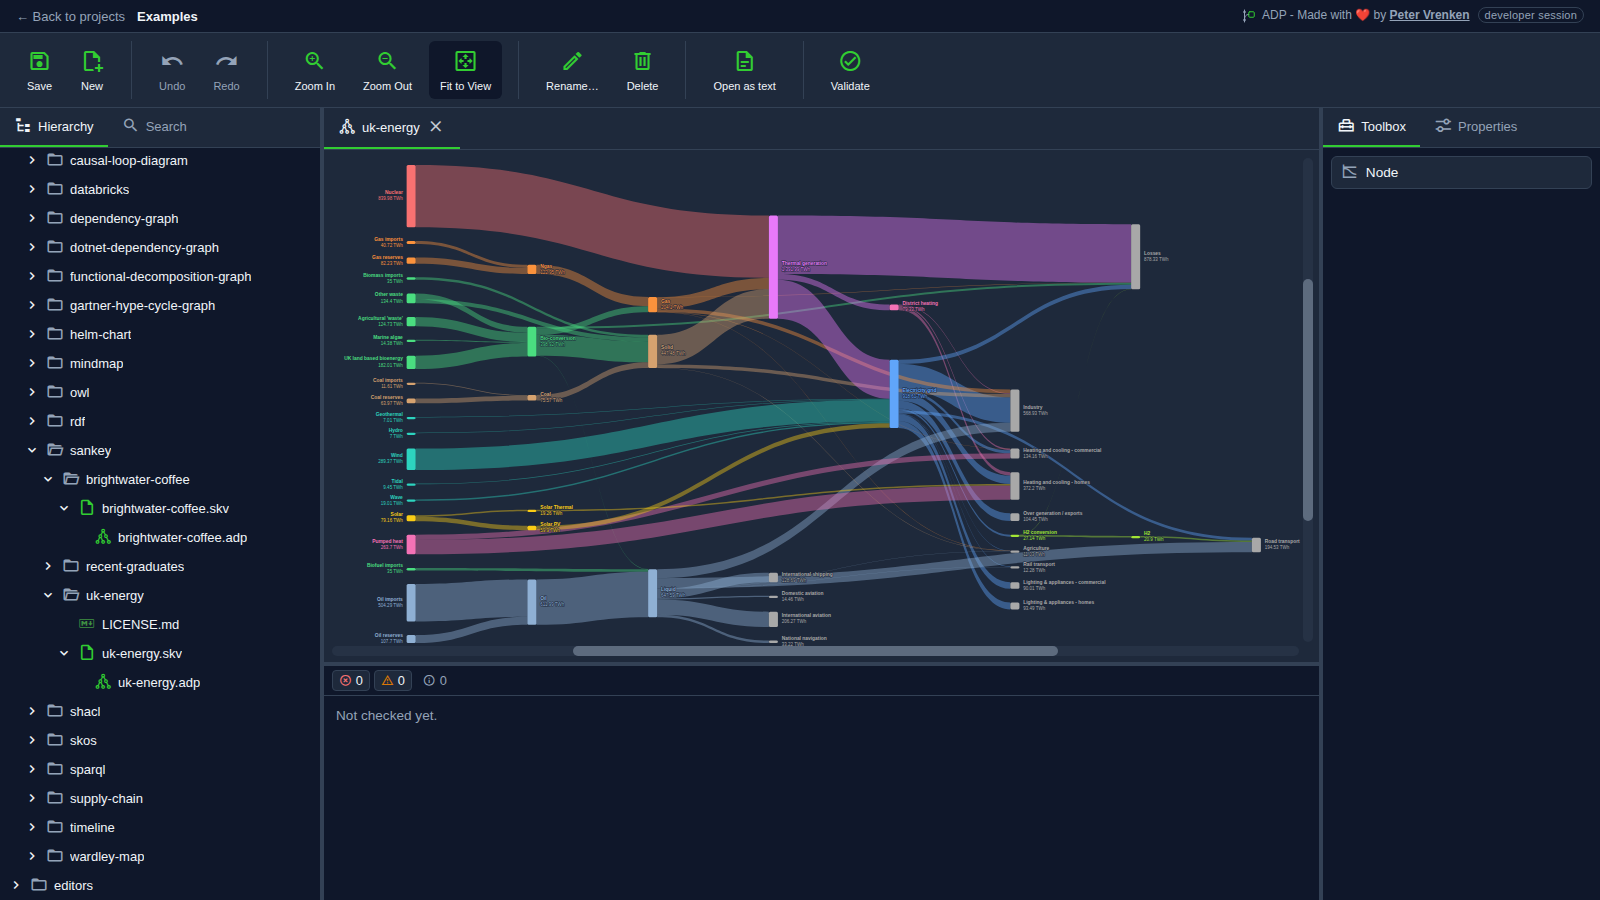
Standalone, at 2bf65f1
What is visible: The UK energy flows from supplies on the left, through conversion, to the uses and losses on the right, each node and band in its own colour with its value in TWh. Nothing selected.
Why it matters: Dozens of energy sources, conversions and uses stay readable because each node and band keeps its own colour and value and the columns balance, which shows that the diagram scales from a small statement to a national energy system.
Licence: Apache-2.0
Background
Focus areas
Sources
etalii-adp/etalii.adp.ide.standalone@9b232f0docs/tools.md, licence Apache-2.0etalii-adp/etalii.adp.ide.intellij@dc9c697docs/tools.md, licence Apache-2.0etalii-adp/etalii.adp.ide.vscode@ab93d8fdocs/tools.md, licence Apache-2.0etalii-adp/etalii.adp.ide.standalone@c400088docs/screenshots/sankey-brightwater-coffee.png, licence Apache-2.0etalii-adp/etalii.adp.ide.standalone@2bf65f1docs/screenshots/sankey-recent-graduates-light.png, licence Apache-2.0etalii-adp/etalii.adp.ide.standalone@2bf65f1docs/screenshots/sankey-uk-energy.png, licence Apache-2.0- Notion, edited (page
3efbe2fd-05b6-81cb-b563-c9378e52e02b), licence Apache-2.0


