

Gartner hype cycle graph
Aims to provide insights in how socio-technological trends relate to each other.
Diagram · origin tag gartner/hypecycle-graph · Strategy & landscape mapping
Availability
| Host | State | How to get it |
|---|---|---|
| Standalone | In progress | In progress |
| Desktop | In progress | In progress |
| IntelliJ Platform | Not planned | Not planned |
| Visual Studio Code | Prototype | Not yet released |
| Eclipse | Not planned | Not planned |
| ThinkRail | Not planned | Not planned |
| Notion | Prototype | Not yet released |
| Claude | Not planned | Not planned |
What it is for
Gartner Hype Cycle (technologies and trends placed along the curve of expectations over time, from innovation trigger to plateau of productivity, with the relations between them)
Why a specialized view helps
The Hype Cycle's meaning lies in the position on its curve; a dedicated tool keeps each item on the curve and relates them, which free drawing loses.
File formats
| Extension | Format | Reads | Writes |
|---|---|---|---|
.ghg | .ghg | Yes | Yes |
Screenshots
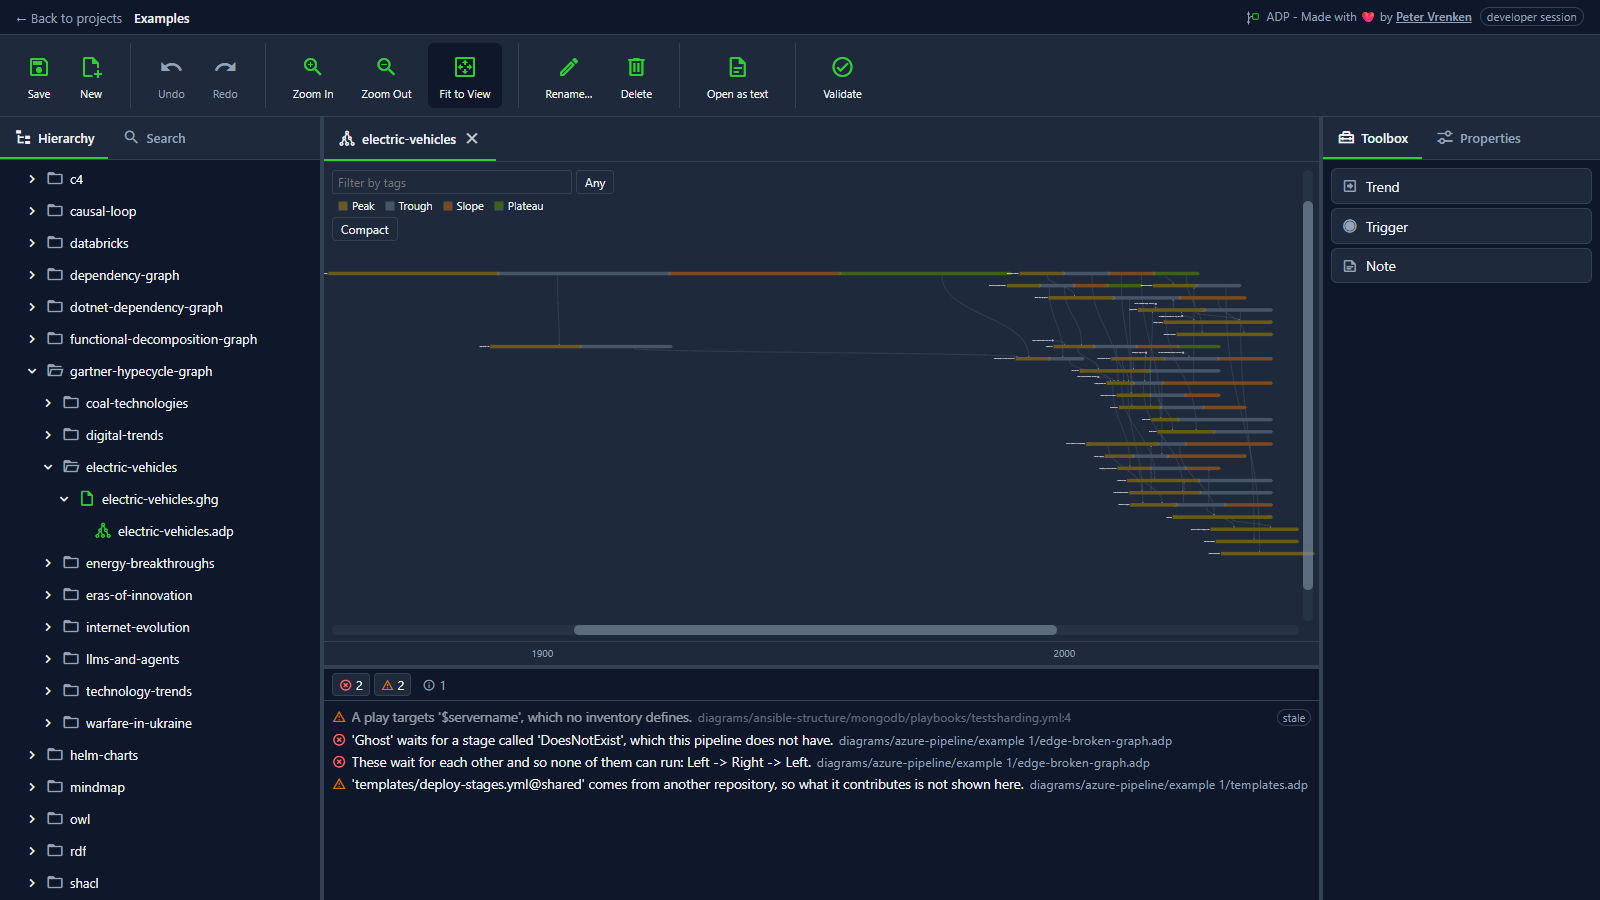
Standalone, at 3e2df46
What is visible: The trends as banners on the year axis (1900 and 2000 labelled along the bottom), coloured by phase with the Peak/Trough/Slope/Plateau key and the tag filter above; Toolbox showing Trend, Trigger and Note. **Not fitted**: fitting a century-long axis squeezes every banner into a sliver, so the document's stored view is kept. Nothing selected.
Why it matters: Trends sit as banners along the years, coloured by their phase on the curve, with a filter by tag, so how technologies rise, fall and mature relative to each other can be compared over a long span.
Licence: Apache-2.0
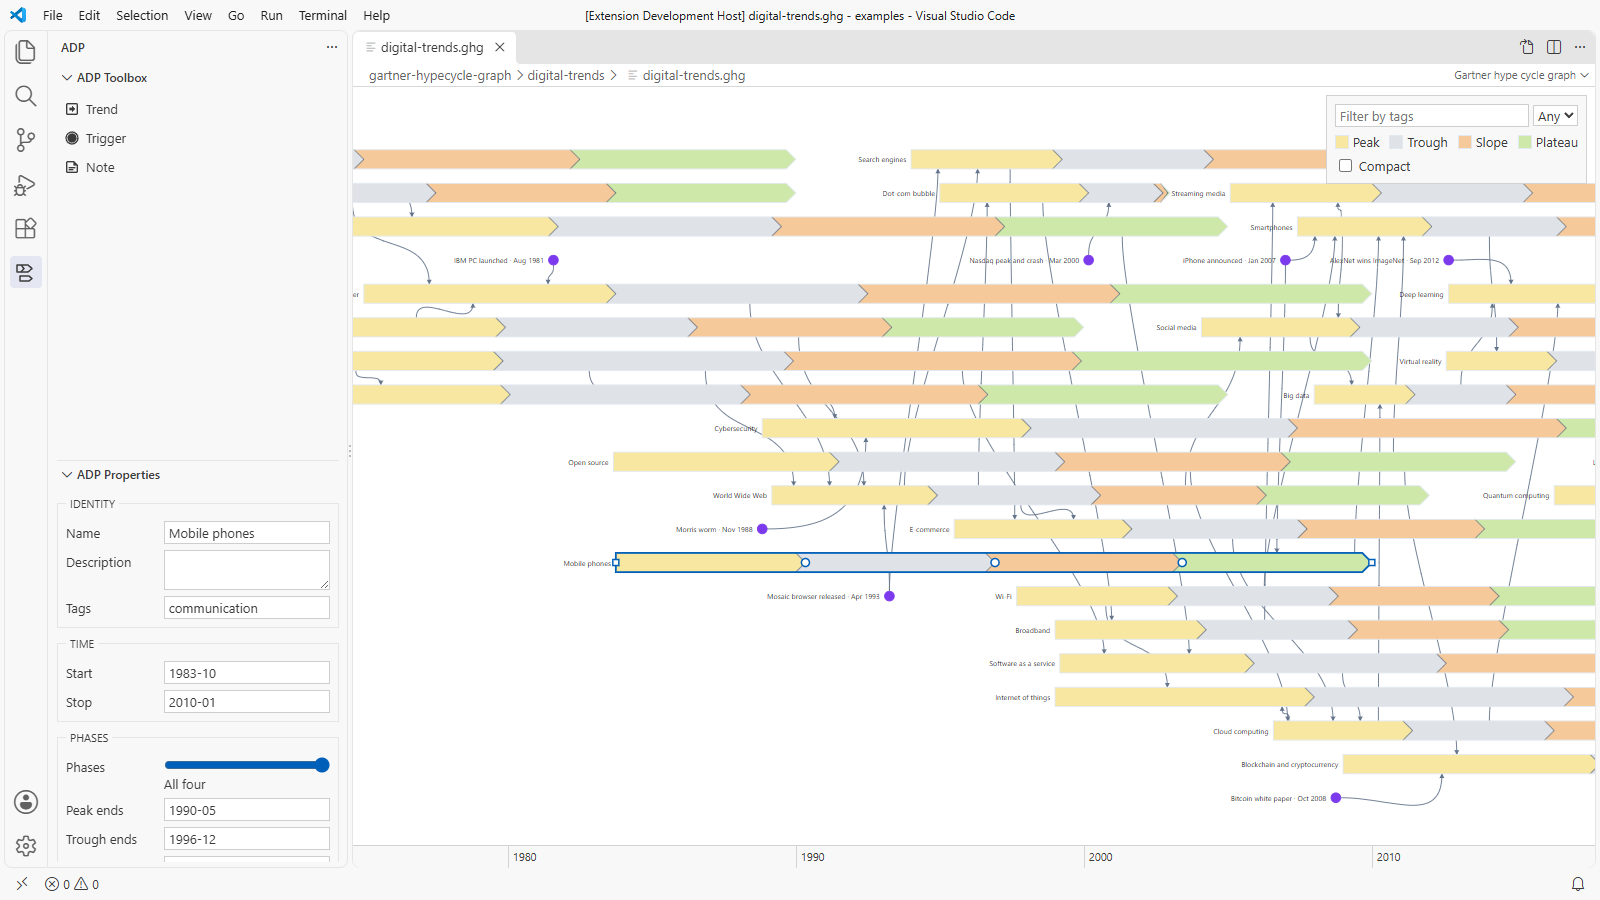
Visual Studio Code, at 412d417
What is visible: The digital trends as banners on the year axis, coloured by phase, with the Peak/Trough/Slope/Plateau key and the tag filter above; ADP Toolbox showing Trend, Trigger and Note; the trend nearest the middle selected, with its properties in ADP Properties. Light theme.
Why it matters: A hype cycle file opens as its graph inside VS Code, each trend a banner coloured by phase on the year axis, with the ADP Toolbox and the selected trend's dates and phases in ADP Properties, here in the light theme.
Licence: Apache-2.0
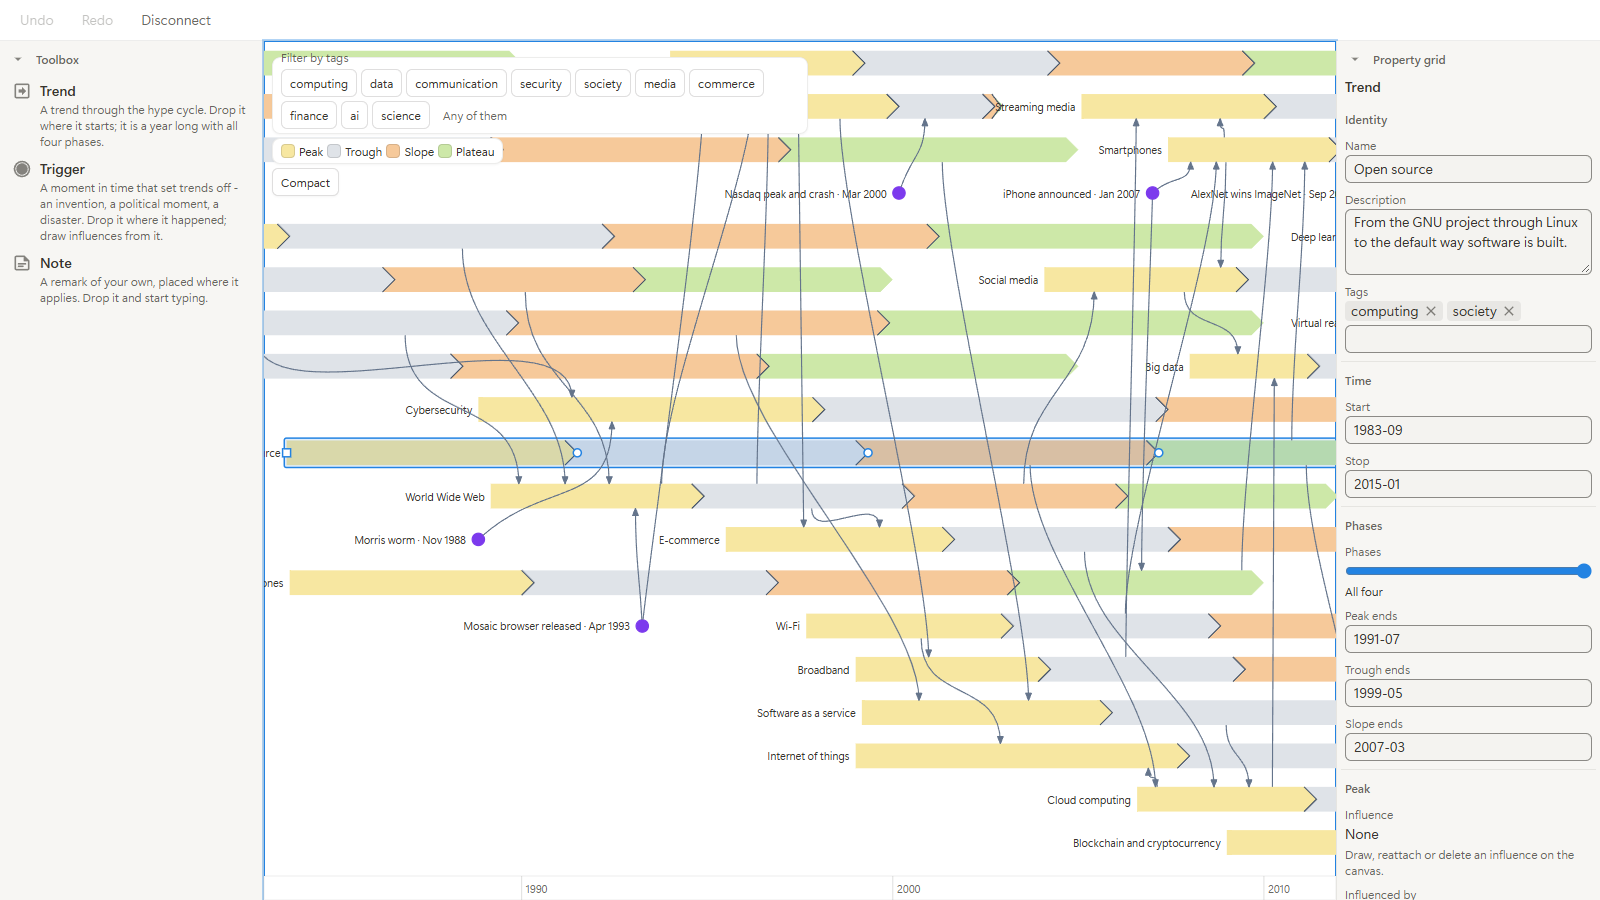
Notion, at df6f9fe
What is visible: The digital trends as banners on the year axis, coloured by phase, with their names, triggers and influences, the tag filter and the phase key above, the toolbox at the left and the selected trend's properties in the property grid at the right. Light appearance.
Why it matters: In Notion's light appearance the add-on takes the page's look, with the toolbox and the property grid beside the drawing, so the graph reads as a part of the page it is embedded in.
Licence: Apache-2.0
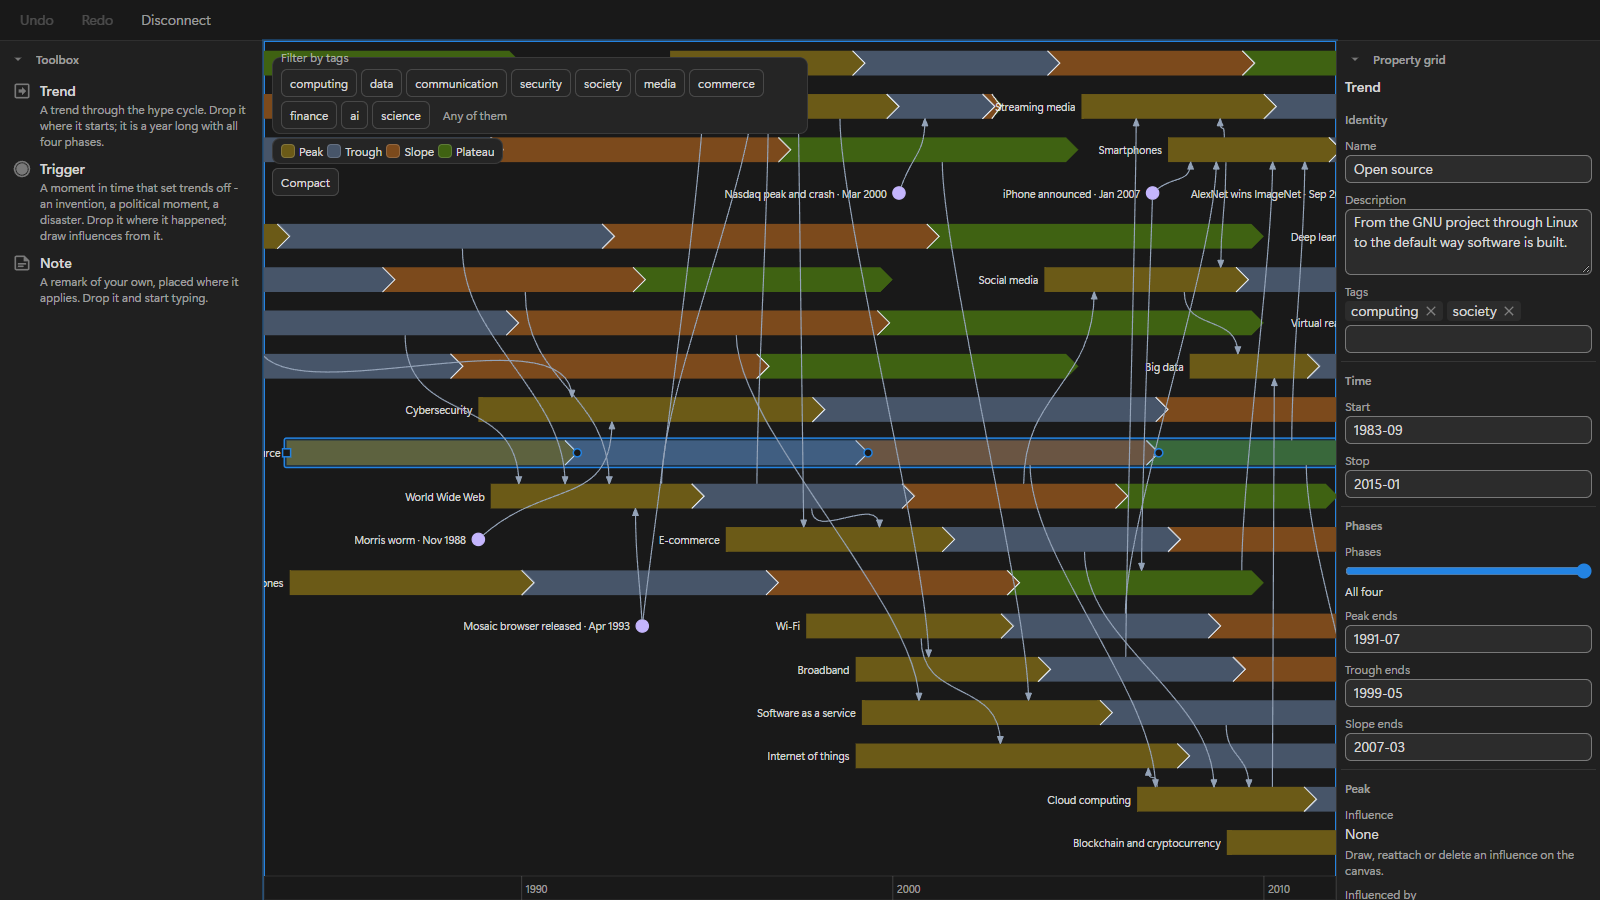
Notion, at df6f9fe
What is visible: The digital trends as banners on the year axis, coloured by phase, with their names, the triggers as dated dots and the influences as curves between them; the tag filter, the Peak/Trough/Slope/Plateau key and the Compact toggle above; the toolbox showing Trend, Trigger and Note; the trend nearest the middle selected, with its properties in the property grid. Dark appearance.
Why it matters: The same hype cycle graph is read and edited inside a Notion page, with its trends, triggers and influences kept as rows of a Notion database, so a team that works in Notion follows how trends moved one another without leaving it.
Licence: Apache-2.0
Background
Focus areas
Sources
etalii-adp/etalii.adp.ide.standalone@9b232f0docs/tools.md, licence Apache-2.0etalii-adp/etalii.adp.ide.intellij@dc9c697docs/tools.md, licence Apache-2.0etalii-adp/etalii.adp.ide.vscode@ab93d8fdocs/tools.md, licence Apache-2.0etalii-adp/etalii.adp.ide.standalone@3e2df46docs/screenshots/hype-cycle.png, licence Apache-2.0etalii-adp/etalii.adp.ide.vscode@412d417docs/screenshots/gartner-hypecycle-graph-light.png, licence Apache-2.0etalii-adp/etalii.adp.ide.notion@df6f9fedocs/screenshots/gartner-hype-cycle-graph-light.png, licence Apache-2.0etalii-adp/etalii.adp.ide.notion@df6f9fedocs/screenshots/gartner-hype-cycle-graph.png, licence Apache-2.0- Notion, edited (page
3e7be2fd-05b6-80af-8bb1-faac5ac32654), licence Apache-2.0


