

Timeline diagram
Lay out activities as bars along time, on rows, with the connections between them.
Diagram · origin tag generic/timeline · Business process & workflow notation
Availability
| Host | State | How to get it |
|---|---|---|
| Standalone | Available | Install from v0.1.3826-alpha |
| Desktop | Not yet released | Not yet released |
| IntelliJ Platform | Not planned | Not planned |
| Visual Studio Code | Not planned | Not planned |
| Eclipse | Not planned | Not planned |
| ThinkRail | Not planned | Not planned |
| Notion | Not planned | Not planned |
| Claude | Not planned | Not planned |
What it is for
Timeline diagram (left-to-right, elements spanning begin→end on snap-to rows, bezier connections; `.tml` — Timeline Markup Language); `timeline-diagram` (specification removed from the tree; in history before `ece03c36`)
Why a specialized view helps
Time is the axis that matters; a dedicated timeline tool snaps elements to rows and dates, which a generic canvas leaves to the eye.
File formats
| Extension | Format | Reads | Writes |
|---|---|---|---|
.tml | .tml | Yes | Yes |
Screenshots
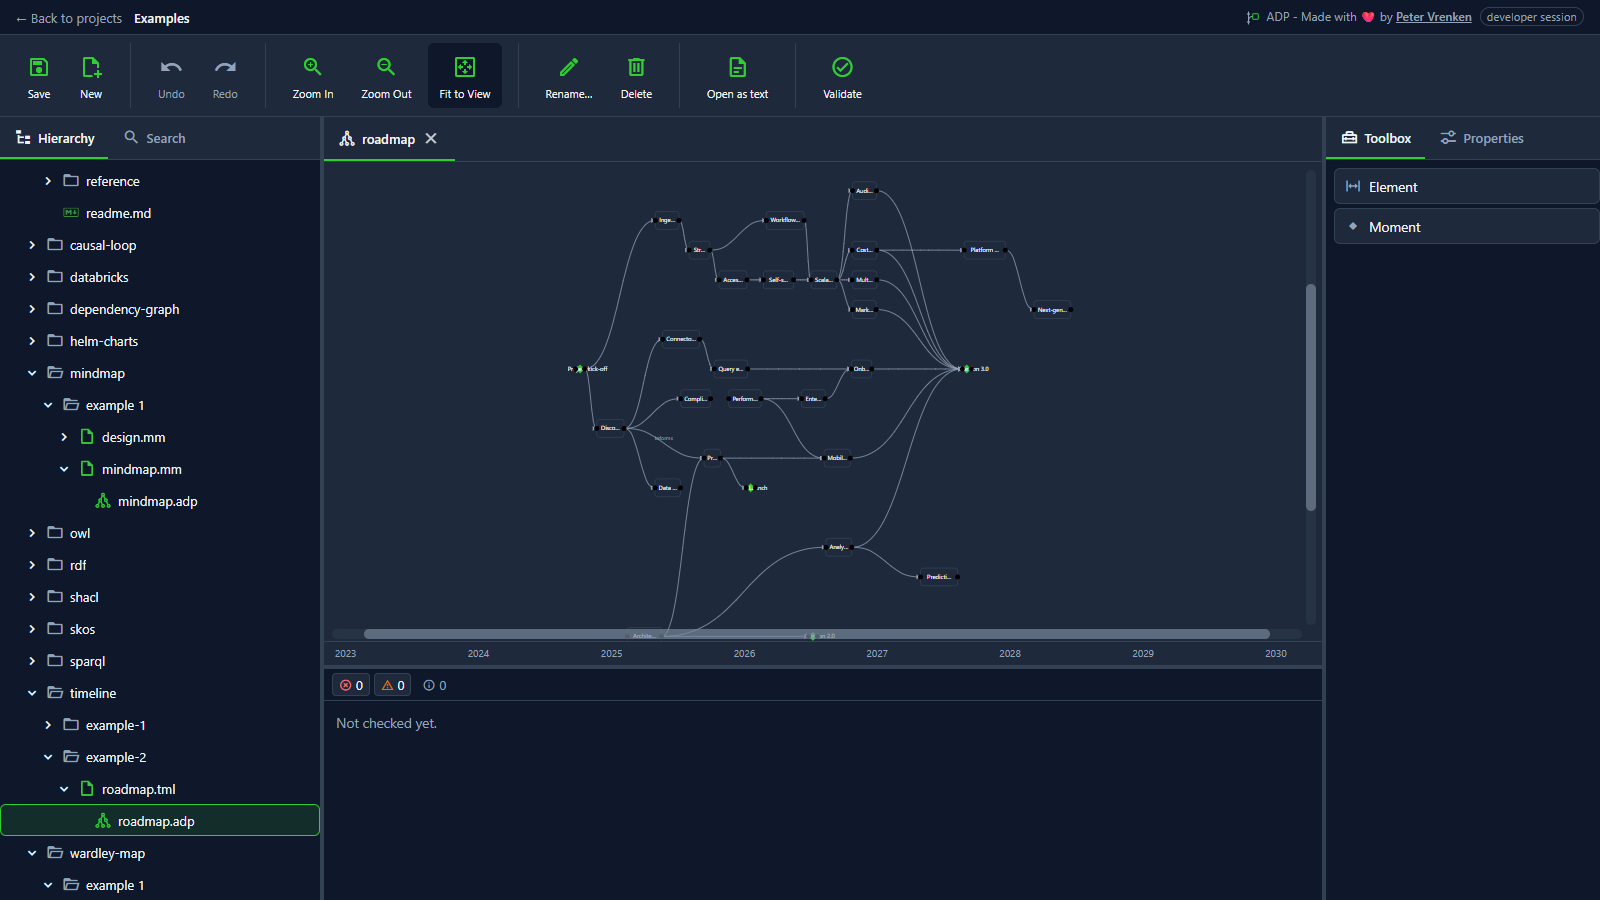
Standalone, at 9ebcbf4
What is visible: Periods and moments on rows, the year ruler along the bottom, connections drawn; Toolbox showing Element and Moment. Nothing selected.
Why it matters: Periods and moments sit on rows against a year ruler, with connections between them, so a multi-year roadmap shows what overlaps and what waits on what.
Licence: Apache-2.0
Background
- Distinct from mermaid/gantt: placement is authored on both axes, not computed, and connections are arbitrary rather than scheduling dependencies
Focus areas
Sources
etalii-adp/etalii.adp.ide.standalone@9b232f0docs/tools.md, licence Apache-2.0etalii-adp/etalii.adp.ide.intellij@dc9c697docs/tools.md, licence Apache-2.0etalii-adp/etalii.adp.ide.vscode@ab93d8fdocs/tools.md, licence Apache-2.0etalii-adp/etalii.adp.ide.standalone@9ebcbf4docs/screenshots/timeline.png, licence Apache-2.0- Notion, edited (page
3e7be2fd-05b6-81e2-af47-c423ad1569e6), licence Apache-2.0
