

Causal loop diagram
Aims to make the feedback structure of a system explicit, with every loop's reinforcing or balancing label checked against its own arrows.
Diagram · origin tag systems/causal-loop-diagram · Knowledge & informal modeling
Availability
| Host | State | How to get it |
|---|---|---|
| Standalone | In progress | In progress |
| Desktop | In progress | In progress |
| IntelliJ Platform | Not planned | Not planned |
| Visual Studio Code | Not planned | Not planned |
| Eclipse | Not planned | Not planned |
| ThinkRail | Not planned | Not planned |
| Notion | Not planned | Not planned |
| Claude | Not planned | Not planned |
What it is for
Causal loop diagram (variables joined by polarised causal links, with the feedback loops they form enumerated and labelled `R` or `B` by arithmetic rather than by assertion; `.cld` — ADP’s own line-oriented text format, adopted after XMILE was rejected for carrying stocks, flows and equations this diagram states none of, and carrying one presentation word of its own, `flipped`, which bows a link’s arc to the other side of its chord where the automatic side crosses something); `causal-loop-diagram` (specification removed from the tree; in history before `53f68611`)
Why a specialized view helps
Whether a loop reinforces or balances follows from the signs on its links; a dedicated tool works every loop's label out instead of trusting a hand-drawn R or B.
File formats
| Extension | Format | Reads | Writes |
|---|---|---|---|
.cld | .cld | Yes | Yes |
Screenshots
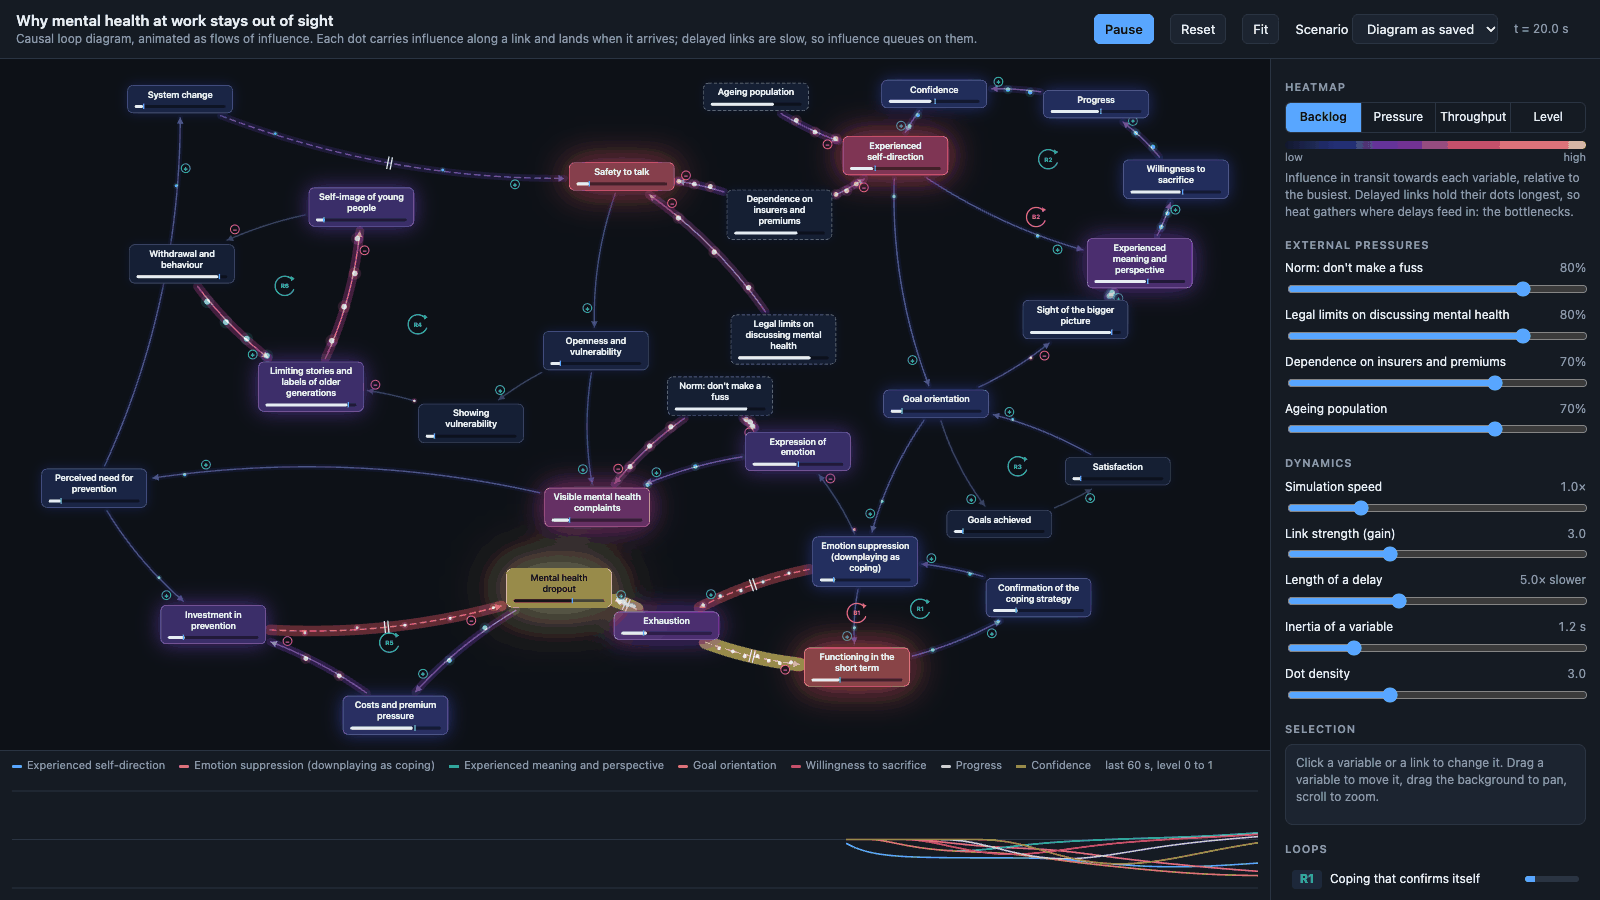
In progress: this shows the tool while it is being built, before it can be used.
Standalone, at 902060c
What is visible: The page after 20 seconds under Backlog at the size above: dots on the links, Mental health dropout, Exhaustion and the delayed links among those hottest, the external variables' sliders, the dynamics and the chart along the bottom. Nothing selected.
Why it matters: The desktop host's ribbon exports any causal loop diagram as one self-contained web page that works offline, opened in your browser. In it you watch influence flow along the links and delays hold it; switch the heatmap between Backlog, Pressure, Throughput and Level to see where it piles up; move the external pressures and the dynamics; push or shock a variable; change a link's strength, delay or polarity; trace each loop and read its gain; follow the main variables in the chart; and pan, zoom and move variables. Its numbers come from a simple model of the diagram's structure, not from measurements.
Licence: Apache-2.0
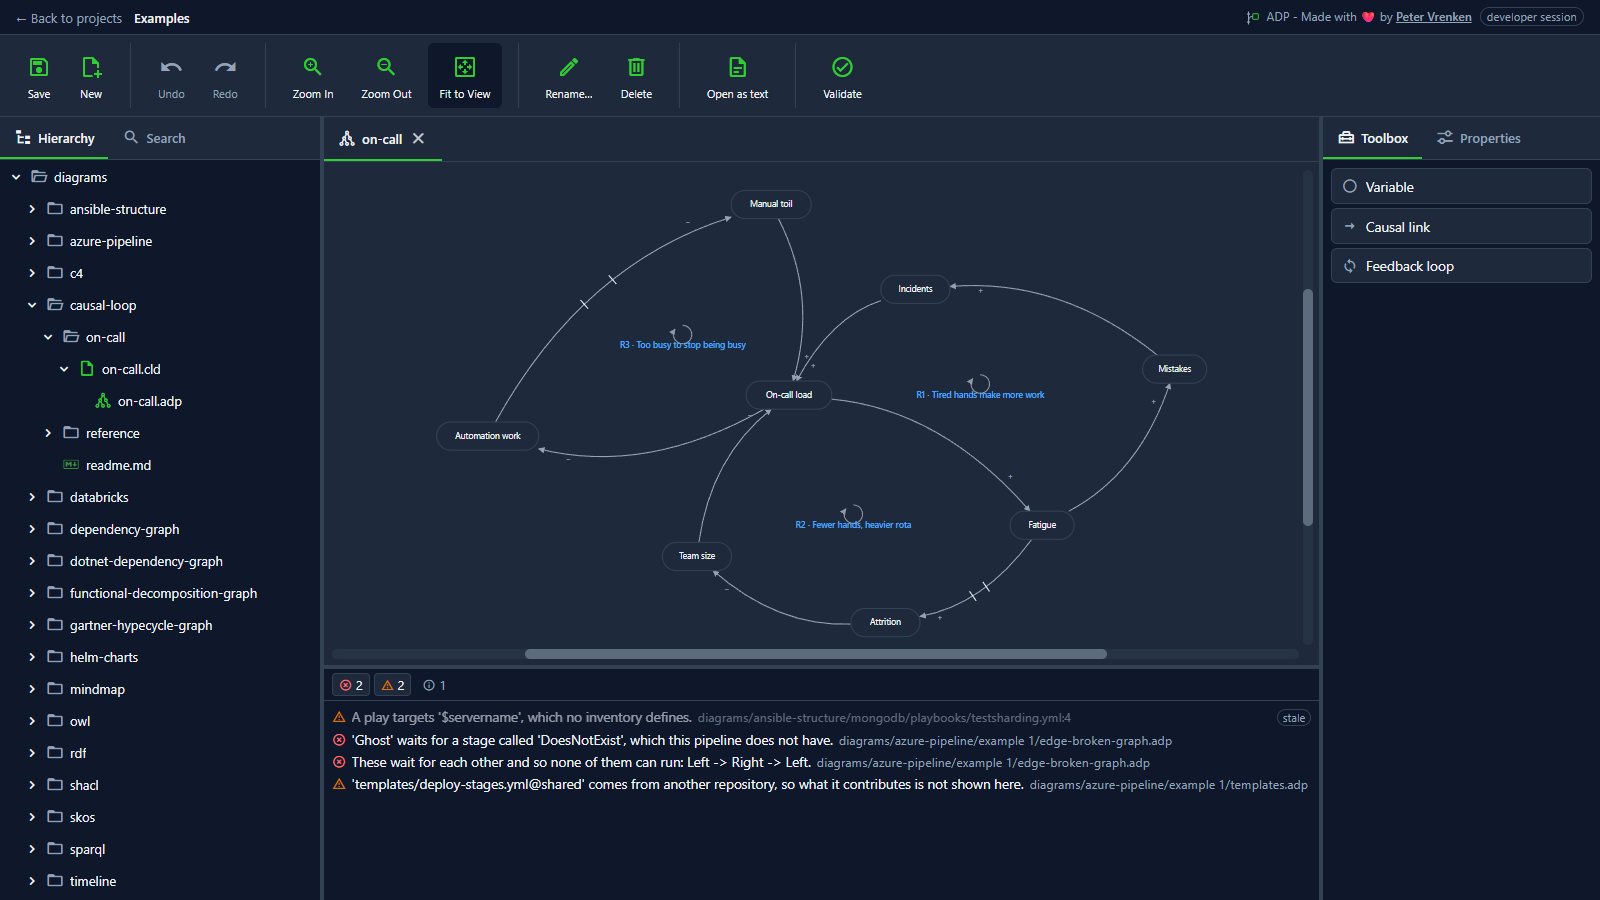
In progress: this shows the tool while it is being built, before it can be used.
Standalone, at 3e2df46
What is visible: The on-call variables joined by polarised links, the delay marks on the slow ones, and the three named loops (R1-R3) at their centres; Toolbox showing Variable, Causal link and Feedback loop. Nothing selected.
Why it matters: Every loop is named and labelled reinforcing or balancing from the signs on its own links, and slow links carry their delay marks, so the feedback structure can be read and trusted rather than inferred.
Licence: Apache-2.0
Example exports
- Business philosophy: Whether a Business Philosophy study is applicable at a university of applied sciences: eighteen variables and ten loops.
- Life insurance: The growth or decline of a life insurance company, redrawn from a public-domain U.S. Department of Energy figure: thirty-four variables and thirty-eight loops. Wikipedia's article on causal loop diagrams shows the figure as its example of reinforcing and balancing loops. Following a loop around tells which it is: a loop with an even number of negative links, none included, reinforces a change, and one with an odd number balances it. Reinforcing loops go with exponential growth or decline, balancing loops with levelling off at a plateau, and delays can make the system fluctuate, which is why finding the loops is a step towards the behaviour a system can show. Robert A. Taylor drew the figure in 2008 for the "Feedback" chapter of the Department of Energy's Introduction to System Dynamics. (Corresponding Wikipedia article can be accessed here)
- Mental health: Why mental health at work stays out of sight: thirty variables and eight loops, a wicked problem drawn as structure alone.
- On-call: Why an on-call rotation gets worse on its own.
- Reference: Every construct the causal loop diagram understands, in one diagram.
- UK cod population: What impacts the cod population in the UK: spawning, recruitment and mortality, carrying capacity as a tipping point, fishing activity and the communities it supports, prices and trade, and the regulation of the catch. Redrawn from a handwritten teaching figure that marks its own loops: forty-nine variables and thirty-five cycles, four of whose labels disagree with their arrows and twelve of which run through the tipping point and cannot be counted. Source: Kamath, A., Palmer, F. I., Manikarachchige, I. and Hutton, C. (2024). Causal Loop Diagram. National Centre for Research Methods online learning resource, University of Southampton. Diagram 7; accessed 31 October 2026.
Background
- The notation is the established one from system dynamics — polarity on the link, R/B on the loop, strokes across a delayed arrow. What ADP adds is the check: a loop is reinforcing on an even count of negative links and balancing on an odd one, so a stated label is verifiable, and a disagreement is reported rather than corrected. Cycles are enumerated with Johnson’s elementary cycles algorithm, bounded. The self-organizing layout adopts Meyer’s method with every source of randomness replaced by a function of the document and the iteration index The diagram and its variables also state the values an exported flow page starts from (its title, dynamics and heatmap reading; a variable's starting level and outside push), and the desktop host exports that page.
Focus areas
Sources
etalii-adp/etalii.adp.ide.standalone@9b232f0docs/tools.md, licence Apache-2.0etalii-adp/etalii.adp.ide.intellij@dc9c697docs/tools.md, licence Apache-2.0etalii-adp/etalii.adp.ide.vscode@ab93d8fdocs/tools.md, licence Apache-2.0etalii-adp/etalii.adp.ide.standalone@902060cdocs/screenshots/causal-loop-flow-page.png, licence Apache-2.0etalii-adp/etalii.adp.ide.standalone@3e2df46docs/screenshots/causal-loop.png, licence Apache-2.0- Notion, edited (page
3e7be2fd-05b6-81ba-bea7-c2f98eae403e), licence Apache-2.0

