

Wardley map
Map a value chain by how visible each component is to users and how evolved it is.
Diagram · origin tag wardley/map · Strategy & landscape mapping
Availability
| Host | State | How to get it |
|---|---|---|
| Standalone | Prototype | Not yet released |
| Desktop | Prototype | Not yet released |
| IntelliJ Platform | Not planned | Not planned |
| Visual Studio Code | Not planned | Not planned |
| Eclipse | Not planned | Not planned |
| ThinkRail | Not planned | Not planned |
| Notion | Not planned | Not planned |
| Claude | Not planned | Not planned |
What it is for
Wardley map (the components of a value chain, placed by their visibility to the user and by their evolution from genesis to commodity, with their dependencies and planned movements)
Why a specialized view helps
The evolution axis puts each component where it is in its life cycle, which is the point of a Wardley map and what a generic diagram leaves out.
File formats
| Extension | Format | Reads | Writes |
|---|---|---|---|
.owm | .owm | Yes | Yes |
Screenshots
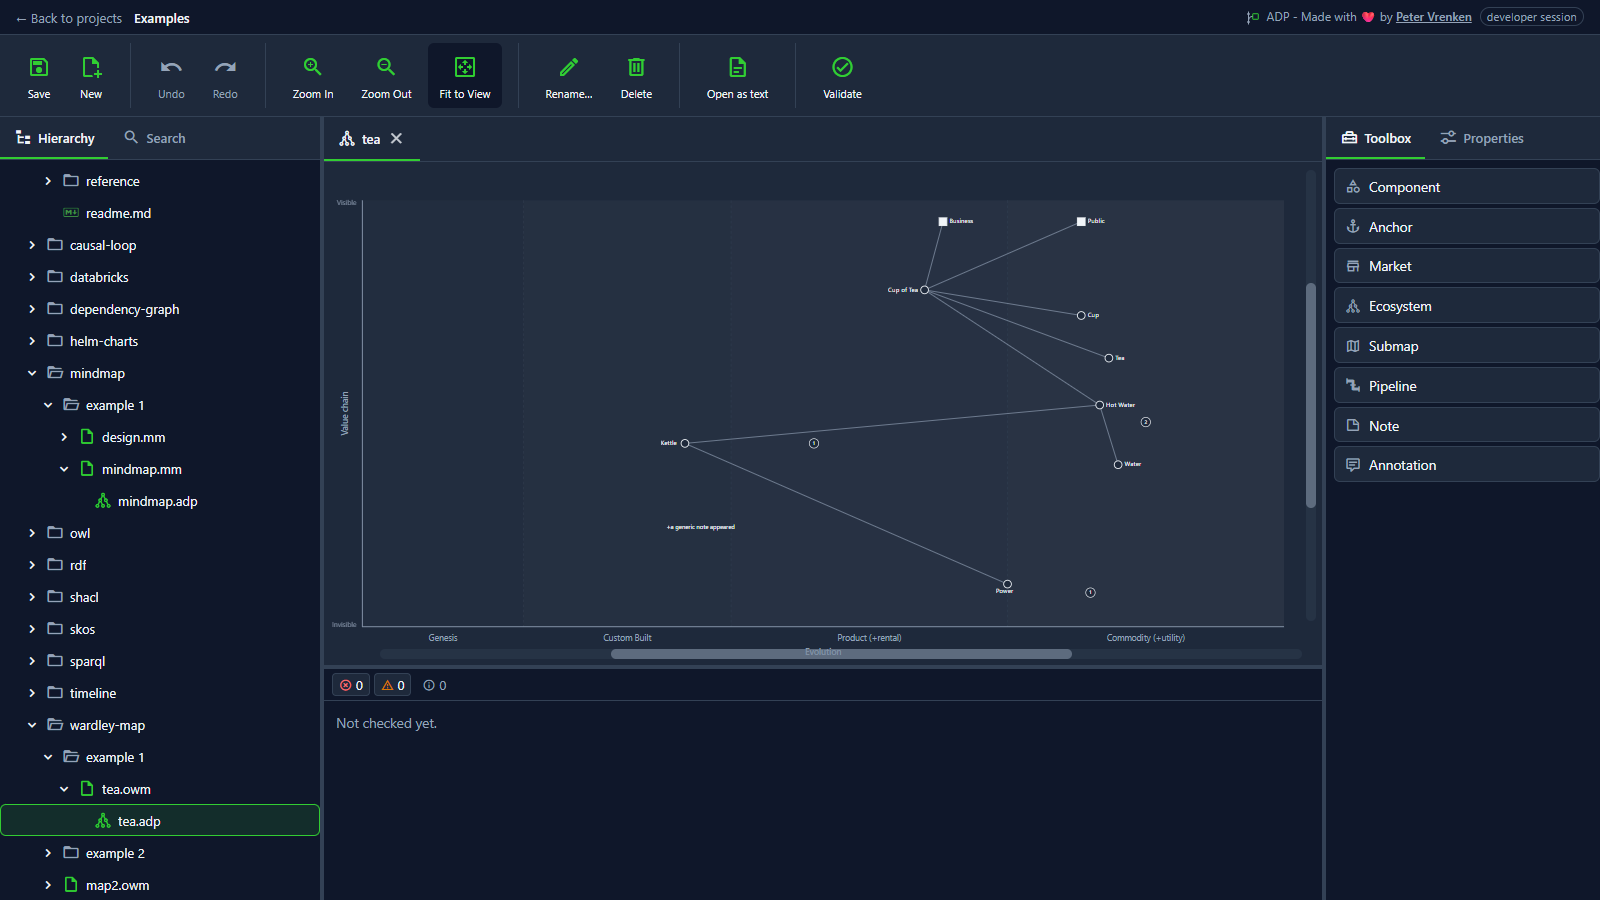
Standalone, at a8616b3
What is visible: The bounded map: both axes labelled, the four evolution bands named along the bottom, components and links drawn. Nothing selected.
Why it matters: Every component sits on the two axes that give a Wardley map its meaning, visibility in the value chain and evolution from genesis to commodity, which a generic canvas cannot enforce.
Licence: Apache-2.0
Background
Focus areas
Sources
etalii-adp/etalii.adp.ide.standalone@9b232f0docs/tools.md, licence Apache-2.0etalii-adp/etalii.adp.ide.intellij@dc9c697docs/tools.md, licence Apache-2.0etalii-adp/etalii.adp.ide.vscode@ab93d8fdocs/tools.md, licence Apache-2.0etalii-adp/etalii.adp.ide.standalone@a8616b3docs/screenshots/wardley-map.png, licence Apache-2.0- Notion, edited (page
3e7be2fd-05b6-8182-9d65-ebf185c4b251), licence Apache-2.0
